
The pattern arises when trend lines converge, indicating an equilibrium between buyers and sellers. The price fluctuates within a range, reflecting a temporary uncertainty in the market. A breakout of this range can signal either a continuation of the current trend or its change. To trade a "Symmetrical triangle" pattern profitably, it is crucial to correctly identify the breakout point and adjust your strategy depending on the direction of price movement.
Major Takeaways
- A "Triangle" pattern is a formation on a chart that occurs due to converging trend lines indicating a temporary equilibrium between buyers and sellers.
- The pattern can warn about the existing trend continuation or its change, depending on a potential breakout direction.
- "Symmetrical triangles" usually emerge when there is uncertainty in the market when the forces of bulls and bears are roughly equal.
- A breakout of one of the pattern lines signals the beginning of a new trend, most often supported by an increase in trading volumes.
What Is a Symmetrical Triangle Pattern?
A "Symmetrical triangle" is one of the basic patterns of technical analysis, signaling market uncertainty. It forms when the price starts to oscillate within a narrowing range bounded by two trend lines. One line connects the highs, and the other connects the lows.
This narrow price channel shows the balance of power between sellers and buyers. "Symmetrical triangle" chart patterns themselves do not indicate the future trend direction. However, a breakout can signal either the continuation of an existing trend or a potential reversal. Traders usually monitor trading volume to ensure the strength of the signal since volume growth confirms the reliability of the breakout.
"Symmetrical triangles" can be found in all markets and on any time frame, making them a useful and versatile technical analysis tool.
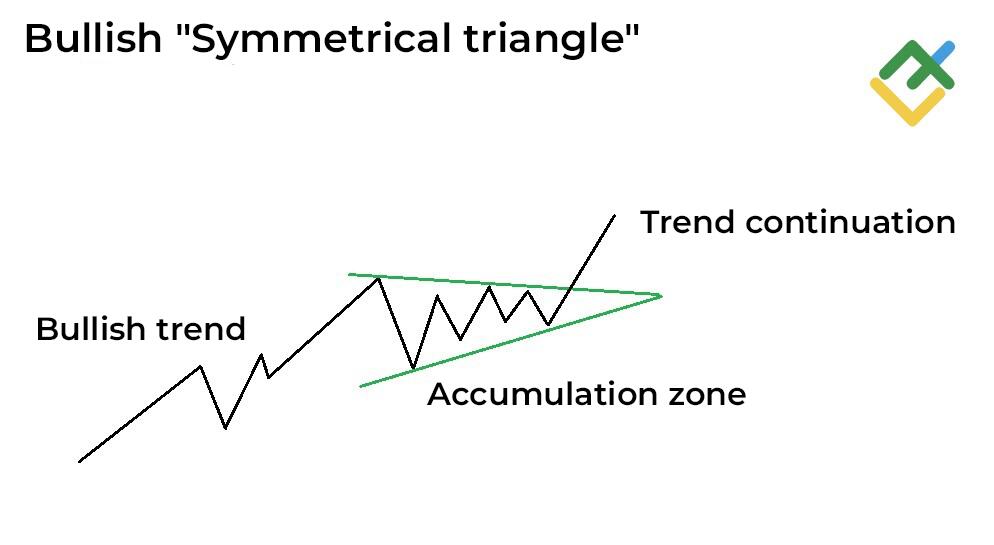
What Is a Bullish Symmetrical Triangle?
A bullish "Symmetrical triangle" pattern occurs in an uptrend and indicates its potential continuation. The price is moving in a narrow range within the pattern, gradually converging to the point where a new impulse is likely. A breakout of the upper boundary suggests the strength of bulls willing to maintain the trend and continue its upward momentum.
Before entering a trade, traders should verify the reliability of the breakout and take into account trading volume. A confirmed bullish breakout provides a strong signal of uptrend continuation, reducing the risk of entering a position prematurely.
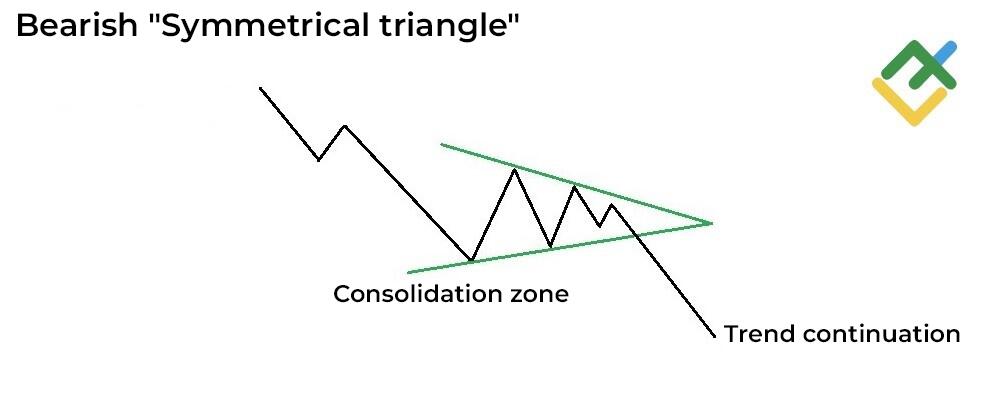
What Is a Bearish Symmetrical Triangle?
A bearish "Symmetrical triangle" pattern emerges in a downtrend, indicating the potential trend continuation. The price fluctuates in a tightening range within the pattern, where the descending resistance line caps upward movement, and the ascending support line limits further decline.
After breaking through the pattern's lower line, the downtrend intensifies, confirming the dominance of sellers in the market. In order to minimize risks, traders should wait for an increase in trading volume, which will validate the reliability of the signal.
What Does Symmetrical Triangle Show?
"Symmetrical triangle" in trading is a pattern that points to the balance of power between buyers and sellers, creating temporary ambiguity in the price movement. The pattern itself does not show the direction of potential price movement, but it does signal an imminent breakout of one of the triangle's boundaries.
When the price crosses the upper line, it may indicate a continuation of the uptrend. Conversely, breaching the lower line indicates further decline and dominance of sellers. Breakouts are usually accompanied by a surge in trading volume, confirming the reliability of the signal. This pattern can be used on different time frames, making it a valuable tool for assessing potential price direction.
Symmetrical Triangle Example
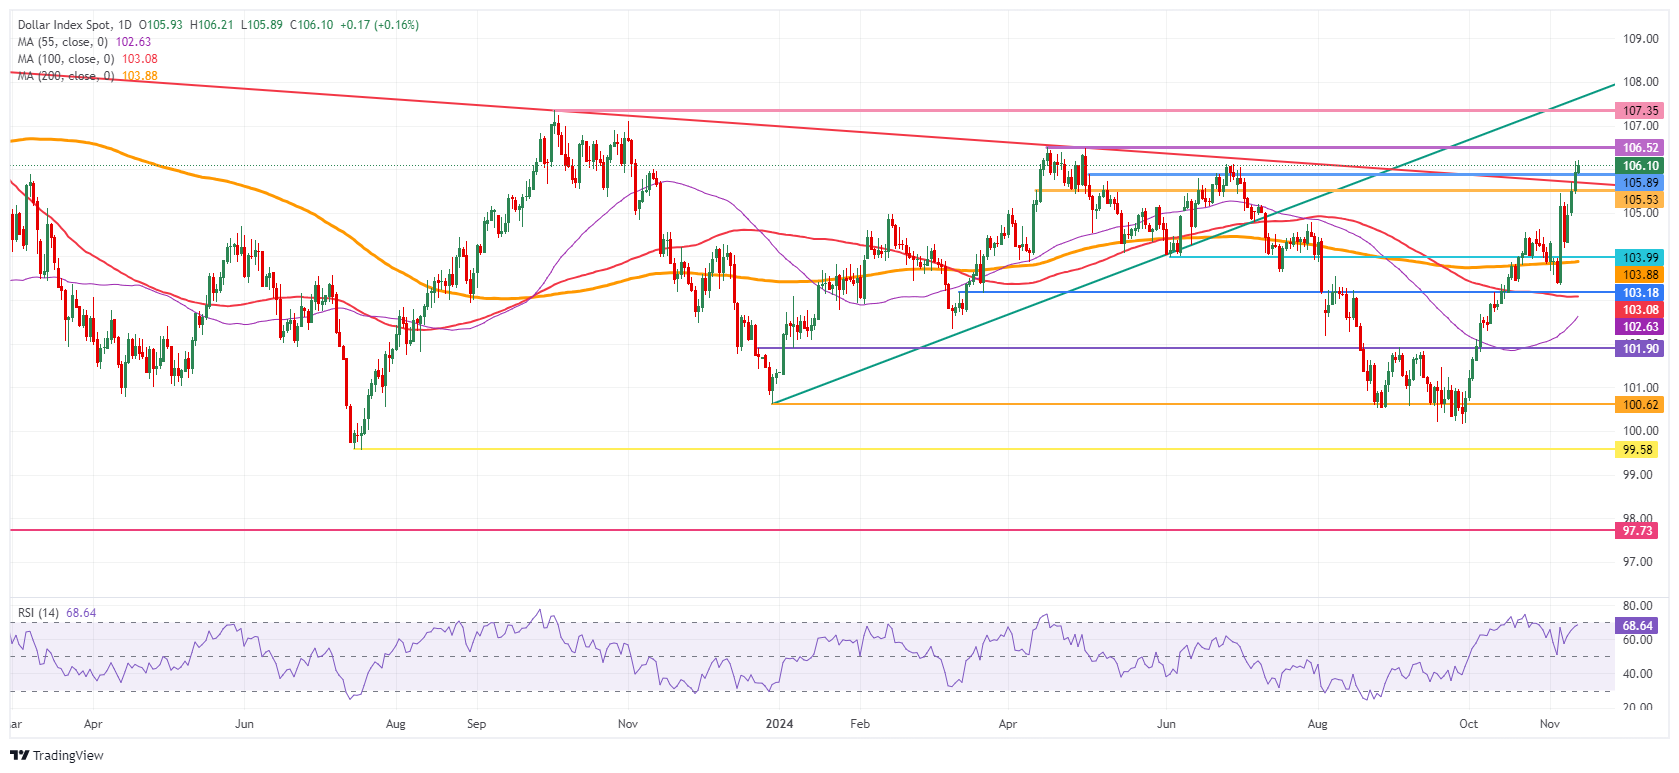
The XAUUSD chart below illustrates a "Symmetrical triangle" emergence on the daily time frame from March to April 2023. During this period, the instrument was fluctuating between two converging trend lines—a descending resistance line and an ascending support line—forming a classic "Symmetrical triangle."
As each swing occurs, the highs gradually decrease while the lows rise, creating a narrowed triangle formation. This indicates a period of consolidation in the market when the pressure of buyers and sellers is approximately the same. As for the XAUUSD pair, the price ranged between $1,920 and $2,010.
After a breakout above the upper line of the "Triangle," the price jumped significantly, confirming the continuation of the uptrend. Such price movement is considered a signal to open long trades. However, pay attention to the trading volume during the breakout to ensure the strength and reliability of the signal.
How to Spot the Symmetrical Triangle Chart Pattern
- To identify a "Symmetrical triangle" on a chart, you need to find converging trend lines. One line should connect the descending highs, and the other should touch the ascending lows. These lines should narrow, forming a triangular shape.
- Although identifying a "Symmetrical triangle" is straightforward, it is essential to correctly predict the subsequent price direction. A trend line breakout is often accompanied by a strong movement toward the breakout point, which helps traders make more accurate decisions when opening trades.
Trading With the Symmetrical Triangle Pattern
Trading a "Symmetrical triangle" involves spotting the moment when one of its boundaries is violated. Traders open positions immediately after the price breaks through the "Triangle" boundaries, regardless of whether it is through the upper or lower line. An upside breakout gives a signal to open a long trade, while a downside breakout creates selling opportunities.
To safeguard against a false breakout, it is advisable to place a stop-loss order just below the lower trend line in a long trade and above the upper one in a short trade. This strategy helps to reduce risks in case of a sharp change in price direction.
Conclusion
A "Symmetrical triangle" is a technical analysis chart pattern commonly utilized to guide trading decisions. It reflects market uncertainty and signals a possible strong price movement after the breakdown of one of the trend lines.
Despite its versatility, a "Symmetrical triangle" pattern itself does not give an accurate indication of the existing trend continuation or a reversal. That is why buyers and sellers should always pay attention to trading volumes and other confirming indicators.
This pattern is used in bullish and bearish markets and can signal both trend continuation and reversal. The versatility of the pattern makes it an effective tool for analyzing the charts of any time frame and financial asset.
Categories
Articles
News
Investors Digests
Main Courses
News
Strategies
Indicators
Guides
Workbooks
Glossary
Lessons
A Glossary
B Glossary
C Glossary
D Glossary
E Glossary
F Glossary
G Glossary
H Glossary
I Glossary
J Glossary
K Glossary
L Glossary
M Glossary
N Glossary
O Glossary
P Glossary
Q Glossary
R Glossary
S Glossary
T Glossary
U Glossary
V Glossary
W Glossary
X Glossary
Y GLossary
Z GLossary
Recent posts
Zcash
26 Nov 2024
Zilliqa (ZIL)
26 Nov 2024
Yield Curve
26 Nov 2024